

By Andrew Winslow | Fri, January 21, 22
Welcome to the latest edition of Regional Energy Data Dives, formerly known as REED Renderings. Regional Energy Data Dives will be a series of blogs taking a wider look at data underlying regional demand-side program trends.
After a busy fall of data collection and analysis, we’ve added the new round of energy efficiency program data to REED and are happy to share it with the public! REED now holds nine years of program data covering 2011 to 2019. The REED Master Workbook is available by email request. We’d like to give a big shout out to our state contacts who provide this data every year and welcome New Jersey as our newest state contact. New Jersey began to provide data last year, and we are excited to continue the partnership as the state revamps its energy efficiency portfolio.
Regional Highlights
Now that the data is in, we can start analyzing the results to track trends in energy efficiency programs in the NEEP region. All in all, the region saw a minimal decline in energy savings with the 11 states and District of Columbia claiming 6.68 million megawatt hours (MWh) of net annual electric savings, a decrease of only 9,500 MWh from the previous year. These savings resulted in emission reductions of 4.11 billion pounds of CO2. This is the equivalent of emissions from 225,000 average U.S. homes. Across the region, states are spending more on energy efficiency. The average combined per capita spending on electric and natural gas efficiency was $48.38, an increase of four dollars over 2018.
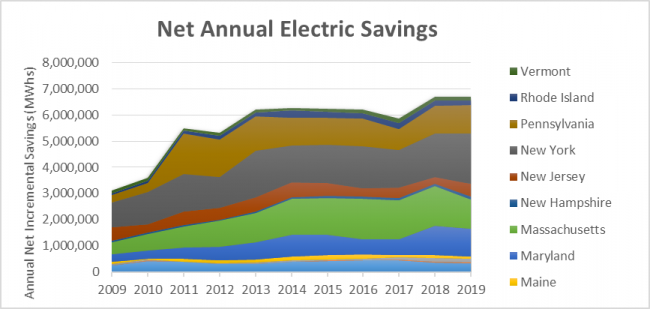
Maryland achieved the most avoided carbon emissions with 1.3 billion pounds, followed closely by New York with 940 million despite New York achieving more electric savings. This is caused by the emissions factors that the states’ Regional Transmission Organizations (RTOs) use to calculate emissions from electricity production on their electric grids. NY-ISO, New York’s RTO, uses an emissions factor of 479 pounds of CO2 per MWh, while Maryland’s RTO, PJM, uses an emissions factor of 851. A higher emissions factor means that the electricity generated on the grid is more carbon intensive. So saving an MWh on a more carbon intensive grid can be more impactful to the environment than saving an MWh on a less carbon intensive grid.
The residential sector accounted for 45 percent of net annual electric savings, and the commercial sector accounted for 53 percent. This represents a shift from 2018 when more savings came from the commercial sector. The remaining two percent of savings came from low-income programs. Low income programs are becoming a focus as states and program administrators consider how to center equity in their offerings. New Energy efficiency plans, such as Massachusetts, contain more language about how the low income population can be better served. Massachusetts’s 2022 – 2024 plan contains an attachment titled “Equity Targets Framework” which outlines goals and objectives for the plan. This attachment was not present in past plans. It will be interesting to track this percentage as states adopt new equity-centered program plans.
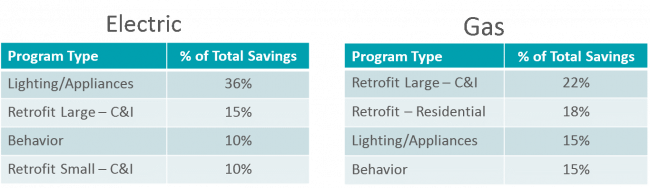
Within the residential and commercial sectors, lighting and appliance programs continued to account for the lion’s share of savings, with 35 percent of electric savings and 15 percent of gas savings. Other top contributors were behavior programs and large commercial retrofits. The percentage of savings claimed by these program types did not diverge much from 2018.
State Spotlight
Not only is New Jersey the newest participating member in REED, the state also saw large increases in energy savings compared to 2018. The state’s electricity savings nearly doubled, jumping from 260 thousand MWh to 491 thousand MWh. This increase is due almost entirely to the Energy Efficiency Products Program, which achieved 15 thousand MWh in 2018 and 268 thousand MWh in 2019. This is impressive considering there was only a relatively small increase in electric spending of $9 million. The state’s gas savings followed the regional trend and decreased by 1.3 million therms despite an increase in natural gas spending. The jump in electric savings resulted in 450 million pounds of avoided CO2, putting New Jersey in the fourth position for most avoided carbon.
In 2018, Governor Murphy signed the Clean Energy Act into law, calling for an overhaul to New Jersey’s sustainable infrastructure. As a part of this transition, the Board of Public Utilities (BPU) announced that investor-owned utilities would administer energy efficiency programs rather than the BPU. This transition took place in 2021. It will be interesting to see how energy efficiency savings are affected, given the program administrator change and more rigorous state goals.
Visit the REED webpage for more information on REED, including links to the Common Statewide Reporting Guidelines, REED Supporting Information documents, and our newest REED vlog series, which is intended to make the REED data more accessible to users by highlighting various strategies to analyze the data. You don’t need to be a data scientist to use REED!