
By Anonymous (not verified) | Wed, March 8, 17
Imagine a world where knowing how much energy you’re using is the norm. In this new world, you would be able to see exactly how much energy you’re using and imagine ways to reduce your usage without ever contacting your utility. Wouldn’t that be something?
Well, guess what? That world is real and is made possible through Advanced Metering Infrastructure (AMI). Current trends in energy saving technology and customer engagement have caused a group of forward-looking utilities to assess the costs and benefits in the implementation of AMI.
What is AMI?
AMI is an integrated system of smart meters, communication networks, and data management software that enables two-way communication between utilities and their customers. The customer is equipped with advanced electronic meters that collect time-based data. After data collection AMI meters transmit collected data through commonly known and available fixed networks.
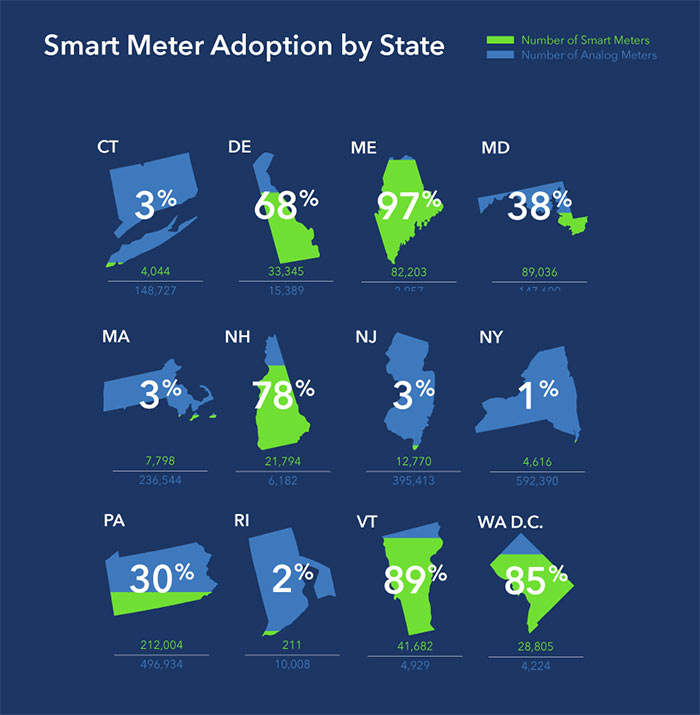
Photo credit: Urjanet
Why Isn’t it More Popular?
Utilities are tasked with showing that these benefits exceed the costs, particularly the capital costs of the system, to state commissions. The business case for AMI deployment depends on the elements and goals involved in the project given each utility’s particular situation. Elements that are taken into consideration include the scale and dimension of the project, such as customers served and deployment timeframe, as well as the technological features. This includes the local characteristics of the grid, the types of technologies that will be deployed with the system, such as smart meters, communication infrastructure, and managing voltage levels and reactive power to achieve efficient grid operation through conservation voltage optimization/volt VAR optimization. The process, up to now, hasn’t been very streamlined or consistent. AMI analyses done by utilities is sometimes disjointed because utilities in some instances fail to include the costs associated with each benefit.
NEEP Report
NEEP’s report, Advanced Metering Infrastructure: Utility Trends and Cost Benefit Analyses in the NEEP Region, provides insight into utility trends regarding costs and benefits of AMI deployment in the Northeast and Mid-Atlantic Region.
The report reviews the costs and benefits evaluated in both prospective and retrospective AMI deployment proposals, while also sharing information that can help regulators, customers and other stakeholders with effective use of the Cost Benefit Analysis Method, to determine the net benefit of an AMI-based demand response program.
Cost-Benefit Analysis
Benefits associated with AMI deployment tend to be largely customer based. For instance, customers benefit from more accurate billing, reduction of peak load and cost savings. Utility operators benefit from remotely reading meters and having the ability to monitor and communicate with the metering system. Benefits included in the cost-benefit analysis are monetized but there are many qualitative benefits too. It is important to use the best available information to determine the benefits that are difficult to monetize. Where it is possible, qualitative benefits such as job creation, social acceptance, consumer inclusion and environmental benefit may be expressed in physical units to provide a more objective basis for the project.
Costs of the AMI system can be subdivided into three general monetized categories. These categories include: capital expenses, operations and maintenance, and customer engagement. Customer engagement costs are often not included unless the utility plans to combine the AMI deployment system with a customer outreach or education program. Utilities may invest in a customer outreach plan to coincide with AMI deployment because a majority of the benefits depend on customer adoption and acceptance.
AMI Deployment in NEEP Region
AMI deployment is relatively low in the NEEP region, but penetration is expected to increase, as utilities begin to develop AMI proposals. The graph below compares the numbers of AMI meters and non-AMI meters and the percent of AMI within each state of the NEEP region during 2015.
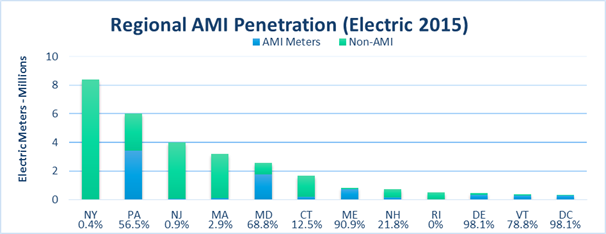
Maryland and Pennsylvania have the highest percent of AMI, while New York and New Jersey have less than one percent of AMI but the New York utilities included AMI deployment plans in their Distributed System Information Plans (DSIPs). Massachusetts and Rhode Island have not yet fully integrated AMI into their utility systems while, Vermont and Maine have over 70 percent AMI.
Utility Trends
This report closely examines seven utility AMI cost-benefit analyses in the NEEP region. Most of the AMI projects examined in this report were proposed in 2015, while Connecticut Light and Power (CLP), Central Maine Power Company (CMP), and Green Mountain Power (GMP) were developed in 2007 and 2010, respectively. Below is a table that shows a brief overview of each utilities’ cost-benefit analysis.
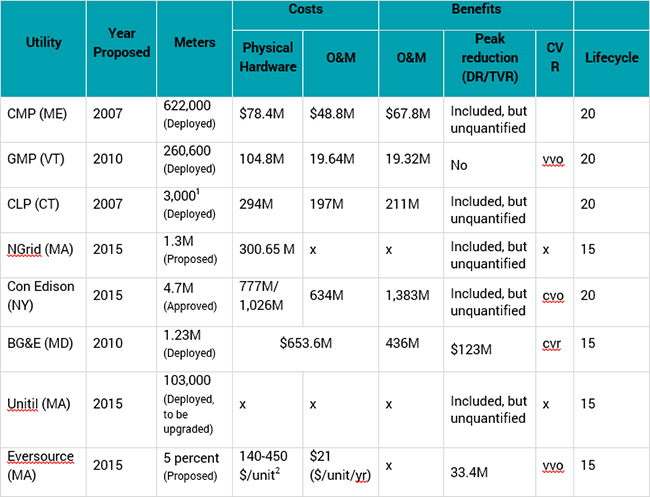
It shows that all utilities, besides GMP included peak reduction through time varying rates (TVR), although only Massachusetts (Eversource) quantified those benefits. Another benefit that is shared among each utility is conservation voltage optimization/volt VAR optimization (CVO/VVO).
Where Do We Go From Here?
The need for new energy efficient infrastructure is more apparent than ever before. AMI provides a unique set of customer and utility based benefits that could potentially change the way we view and use energy going forward.
In order to successfully deploy new and innovative technology, such as AMI, it is imperative that utilities evaluate the cost-effectiveness. By sharing experiences in evaluating AMI, transparency between utilities will help inform the types of costs and benefits that may be included in the analysis. Through this report, NEEP attempts to streamline the process of capturing as many costs and benefits involved in evaluating AMI by providing a resource with a regional perspective of the AMI landscape in the Northeast and Mid-Atlantic states.
Unfortunately, knowing you’re energy usage is not common knowledge among most utility customers. Currently the chances of this being the norm are very slim. Though, as time progresses and we continue to make advancements in customer engagement and energy saving technology, this far-reaching possibility could eventually become a reality.